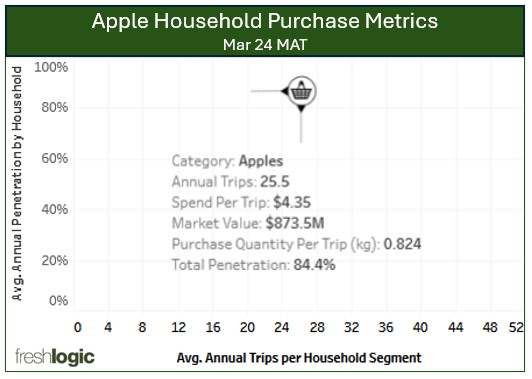
The household purchase metrics for a fruit or vegetable category indicate where investment can improve performance.
The apple metrics in the below chart reflect its mature status, with 84% penetration and 25 shopping trips per year, averaging 824 gms per trip. However, the real value lies in using this information to manage the category and build growth initiatives.

An extension of these metrics reveals 201 million apple retail shopping trips across Australia annually, distributing 165,596 T and generating $873.5 million in retail sales. This information informs planning decisions focused on penetration, purchase quantity, trip frequency, and when plans are made, the business case can be shared with trading partners to validate the growth they can deliver.
Freshlogic market insights are set to deliver this depth of insight, providing a basis to achieve commercial advantages.
If you would like to learn more about your fresh fruit or vegetable market size, shopping trips or any supply chain query, please contact us today.
Stay ahead of the latest trends and insights in the fruit and vegetable supply chain—subscribe to our weekly newsletter today.

