New Growing Systems
Tailored AnalysisMarket assessment and investment analysis for new production system including glasshouses and vertical farming.
Freshlogic’s Growing System Analysis offers in-depth insights into production, distribution, and demand within glasshouse and protected cropping systems (Glasshouse, Polyhouses & Tunnels and Conventional & Outdoor).
Our report uses a detailed dataset that includes:
- International Trade Data: Export & import volumes for fresh produce.
- THRUchainTM Model Outputs: Detailed domestic market volumes, values, & distribution shares.
- Competitive Alternatives Profiling: Analysis of supply & demand for competing product categories.
- Mealpulse™ Food Consumer Panel Data: Consumer purchasing behaviours & attitudes specific to the fresh fruit or vegetable category.
- Horticultural Sector Data: Region-specific production capacity & distribution of cropping systems.
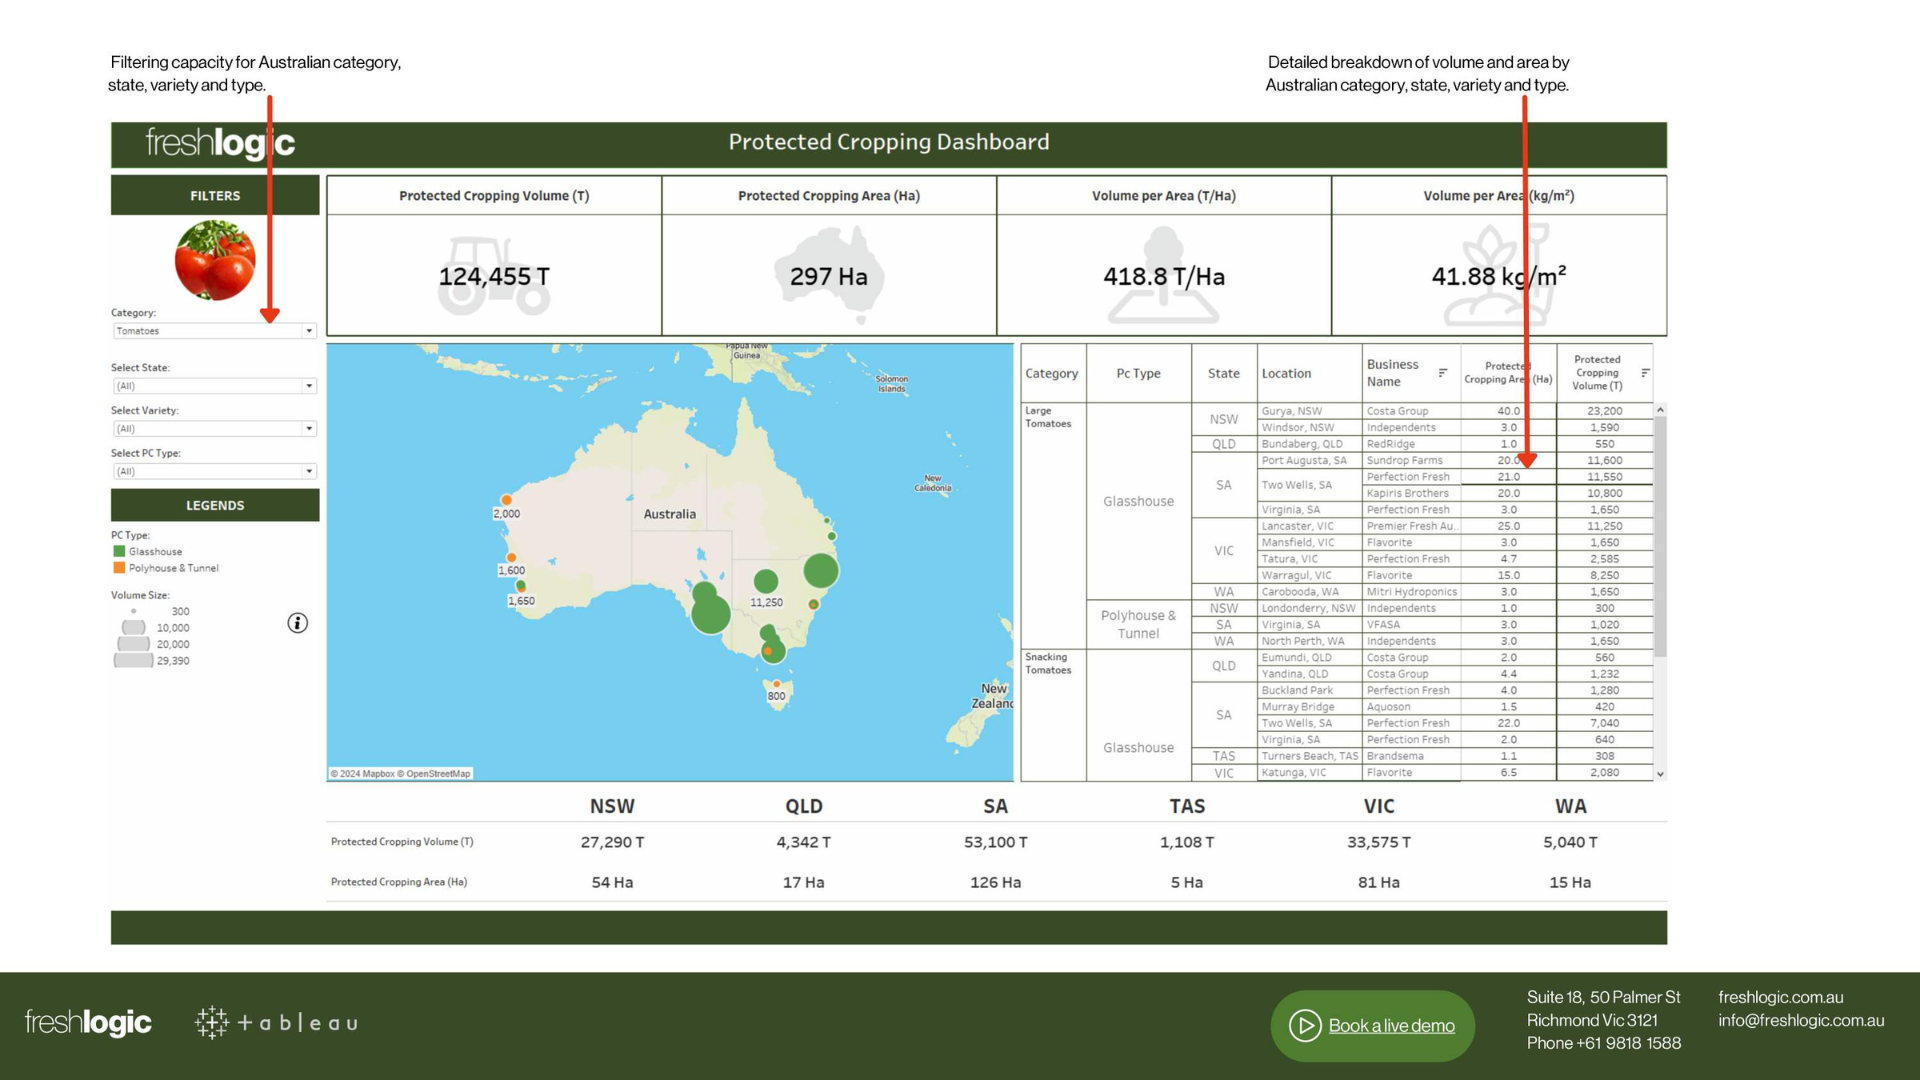
The Growing System Analysis quantifies protected cropping across regions and areas, providing users with the ability to filter and drill down into the data by:
- Volumes analysed by location.
- Comprehensive breakdown of volumes by system (e.g., Glasshouse Area and Volume).
- Location-specific yield evaluation.
- System-specific yield assessment.
This analysis provides businesses and investors with a clear and actionable view of protected cropping systems, forming the basis to:
- Assess market potential & risks for investment in glasshouse or protected cropping systems.
- Quantify production capacity by region & cropping system to inform expansion or acquisition plans.
- Understand competitive alternatives & their influence on market performance.
- Evaluate system-specific yields & identify optimal locations for future investment.
- Make data-driven decisions regarding new ventures, land acquisition, or infrastructure investments in protected cropping.
The data is updated annually, with reports generated based on the most recent financial or calendar year (e.g., ending in June or December).
- Subscription includes 24/7 access to a secure dashboard powered by Tableau, allowing for seamless data visualisation & analysis.
- Customisable reports are available for specific cropping systems or total production, providing decision-makers with detailed, report-ready formats for efficient communication.
Available across 36 categories


