Fresh Snacking Market
Online Tableau Dashboard
Insights into fresh snacking designed to guide investment in New Product Development (NPD) catering for this high-grown meal occasion.
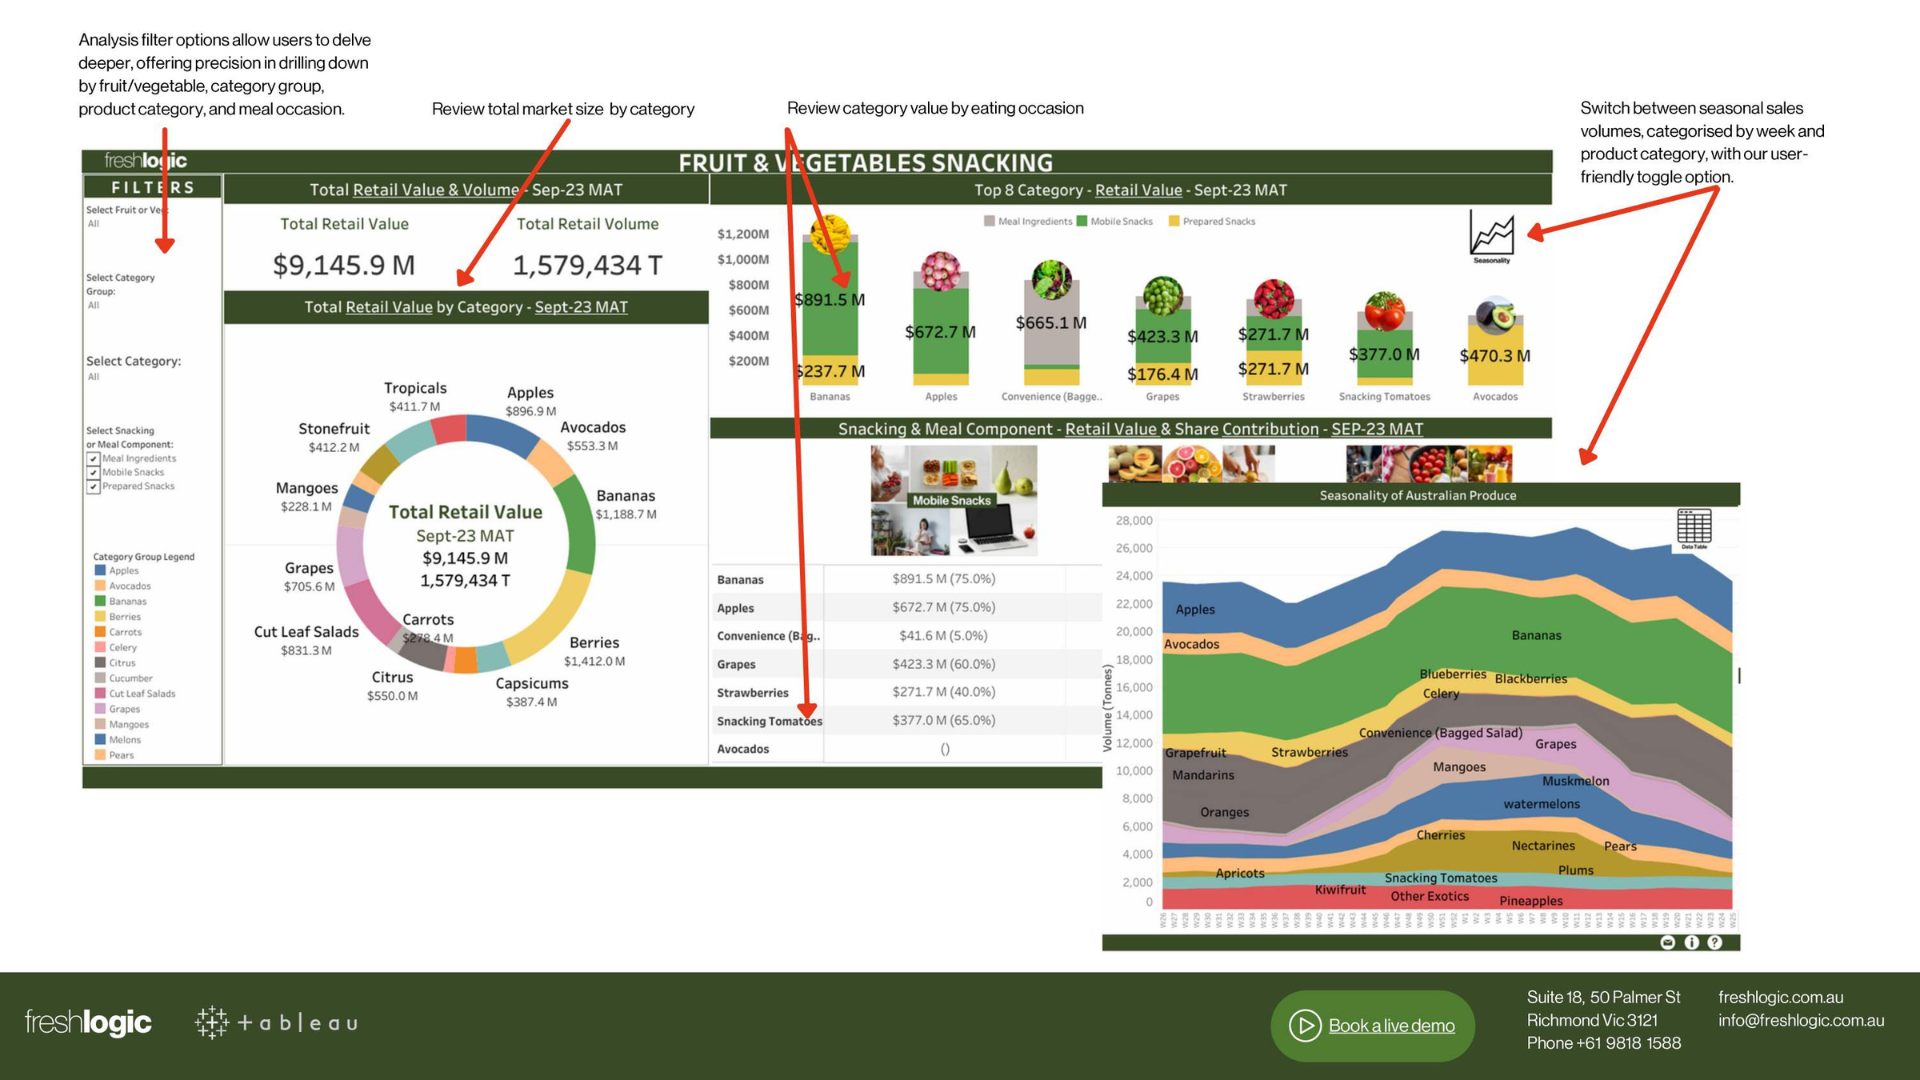
The Fresh Snacking Market Analysis service provides detailed insights into the consumption of fruit and vegetables between meals by capturing data on various snacking occasions.
Comprehensive data includes:
- Market analysis for fruit & vegetable consumption during mobile snacking (typically out of home).
- Insights into home snacking that require minimal preparation.
- Data on products consumed as meal components.
- Weekly seasonal volumes by category, measured in tonnes, for tracking consumption trends.
Analysis drill-downs allow users to assess snacking market size, filtered by:
- Fruit and vegetables.
- Product category.
- Product category group.
- Consumption occasion – mobile snack, home snack or meal component.
Default analysis options for:
- Category value by snack or meal component.
- Total selected retail value and volume.
- Seasonality of Australian produce by week.
- Top-8 category in retail value.
- Retail value and share contribution of snacking, plus meal component by category.
This analysis delivers a clear, actionable view of market dynamics, providing the foundation to:
- Evaluate market performance for fresh snacking products.
- Quantify market share across fruit & vegetable categories. Identify seasonal competitive opportunities & windows for specific products.
- Understand how products are used in snacking occasions to shape product positioning & marketing tactics. Inform business planning with data on the growing snacking trend & its impact on product sales.
The data is updated on a quarterly basis:
- 24-7 access, facilitated by a secure permission-based login system, powered by Tableau visualisation software.
- Subscription options include access for short-term 3-month projects or the convenience of a continuous annual plan.
- Dashboards designed for decision makers in a report-ready format suitable for efficient communication to others.
Available across all fruit and vegetable categories consumed as snacks


