Food Consumer Insights
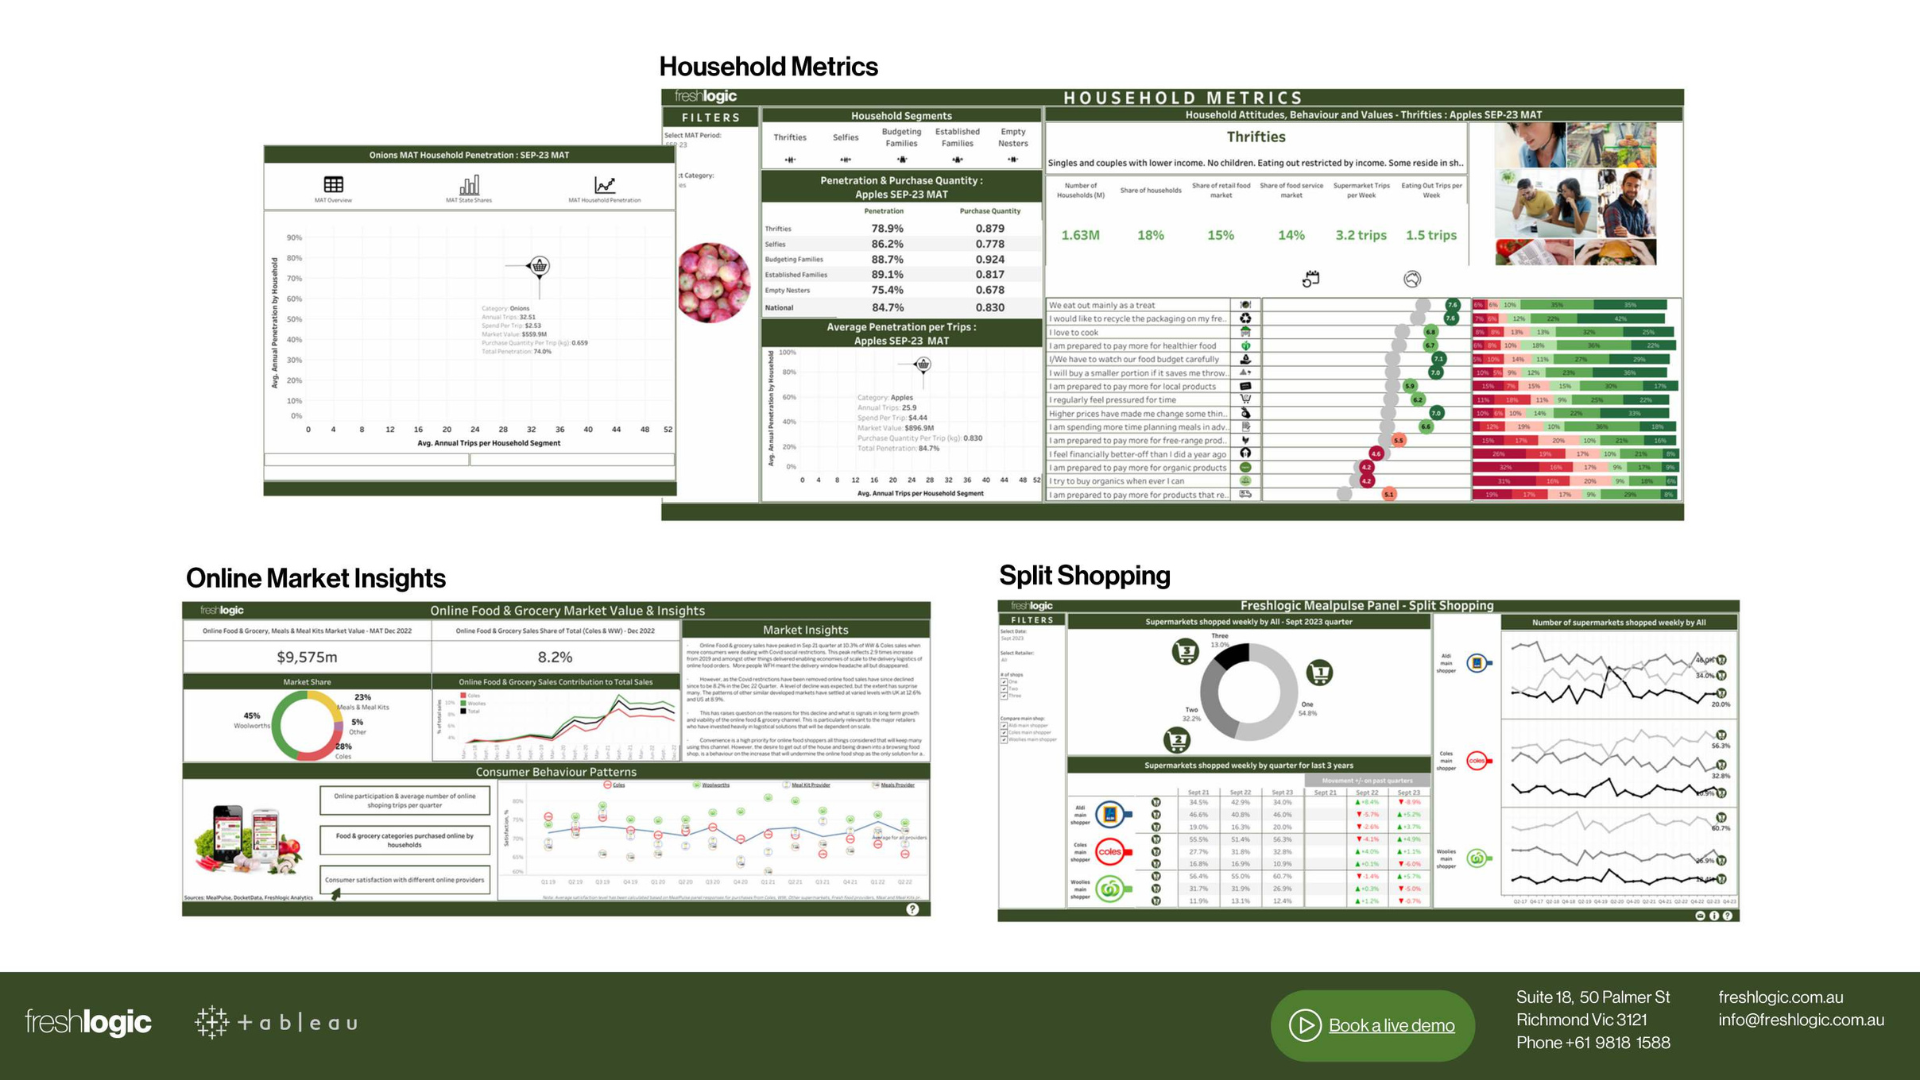
Online Tableau Dashboard
Gain insights into the fresh food buying behavior of Australian households
and how shopping trips, spending, and retailer preferences are shaped by
prevailing attitudes and values.
Mealpulse™ Food Consumer Panel
Capturing 15,000 weeks of household food shopping annually, Mealpulse™ is Freshlogic’s consumer insight platform.
- Track food consumption both at home & away across Australian households.
- 12+ years of historical data to analyse trends, buyer behaviours & key influences.
- Integration of DocketData for detailed purchase insights, facilitating robust demand forecasting.
- Analysis of the Australian Online Food & Grocery channel, quantifying online sales & market share for major retailers & home delivery services, including market size for online fruits & vegetables, consumer participation, spending patters & retailer satisfaction.
- Decision-ready insights reflecting changing consumer attitudes, values & economic pressures.
- Nationally representative samples enabling accurate, data-driven market analysis.
DocketData
Generated from Mealpulse™ panel respondents, DocektData captures detailed retail food purchase receipts.
- Track retail patronage, trip spend, product quantities, basket size, & companion products by retailer.
- 800,000+ product purchase records for robust analysis of buying behaviours.
- Integrates with Mealpulse™ profiles to assess aspirational intent vs actual behaviour by household, retailer, & region.
- Utilises tailored technology to automate data gathering & extraction from each receipt.
- The first system in Australia to collect retail docket data for enhanced consumer research.
Split Shopping
Split Shopping profiles retail shopping patterns by analysis how trips are distributed among major retailers.
- Track changes in each retailer’s share of household making 1,2 or 3 shopping trips per week.
- Effectively measures retailer loyalty & total trip frequency.
- Increasingly relevant as the total number of food shopping trips continues to decline.
- Available through online dashboards, updated monthly.
Data is refreshed on a monthly and quarterly basis
Available across the top 30 categories.


