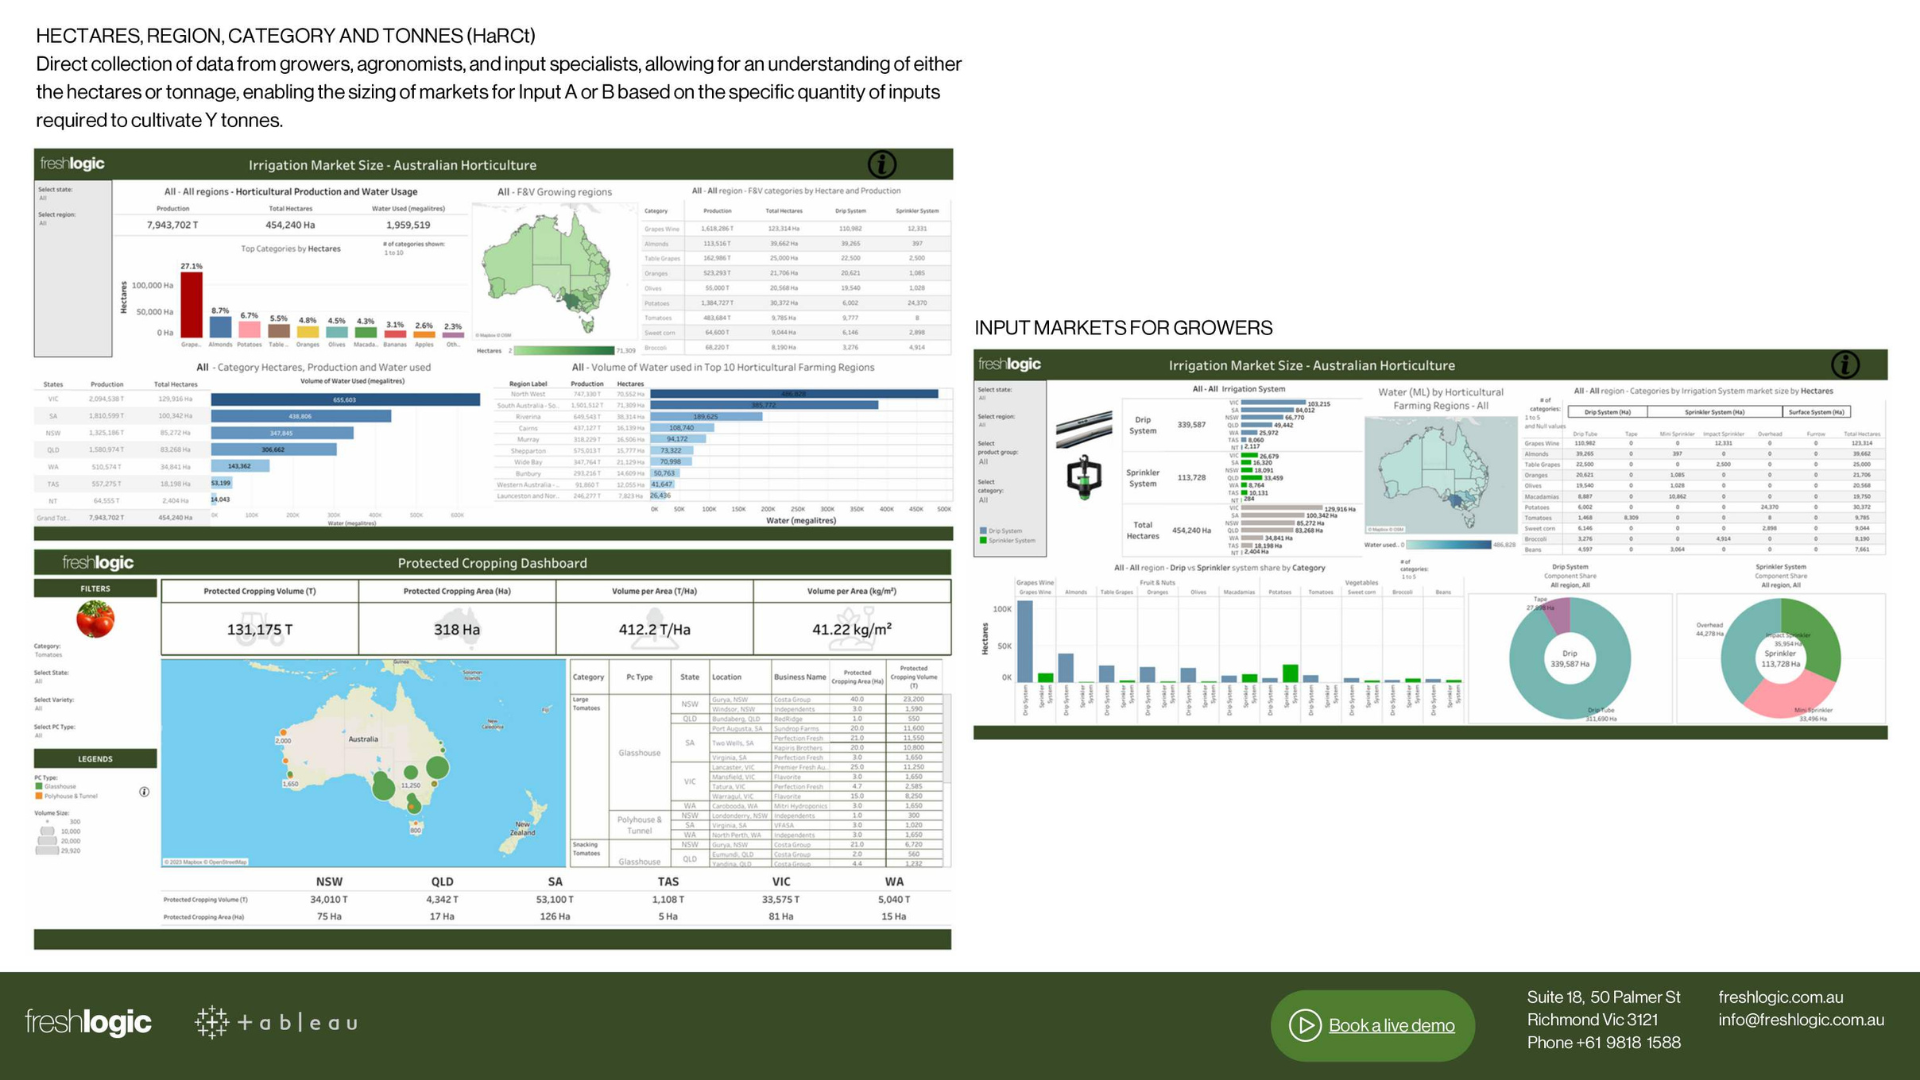
Input Market for Growers
Online Tableau Dashboard
Access to the data and analysis to define the size and growth of fruit and
vegetable production input markets by input type, product category, and
geography. This HaRCt service has the capacity to define inputs by
category and then combine inputs for multiple categories by geography.
The Freshlogic Input Systems Analysis service is designed to provide comprehensive insights into farming and cultivation systems for those seeking to innovate or invest in horticultural input systems.
Comprehensive dataset includes:
- Direct data collection from growers, agronomists, & input specialists.
- Analysis of input systems categorised by Hectares, Region, Category, & Tonnes (HaRCt).
- THRUchain model outputs to comprehend domestic market volumes, values, & distribution channel shares.
- Mealpulse™ food consumer panel data to capture category purchase behaviours & attitudes.
Analysis drill-downs allow users to assess regional and area-based quantification data of input systems, filtered by:
- Volume by Location.
- Volume by System.
- Yield by Location.
- Yield by System.
- Area by location.
- Area by System.
A systematic & detailed analysis that enables you to:
- Gain insights into market sizes of various input systems, guiding investment & input requirements. Profile supply & demand dynamics of competing alternative products.
- Explore regional-level data to profile horticultural crop areas & input system utilisation.
- Insights into demand preferences & market values related to the procurement of input equipment.
- Gain insights into demand preferences & market values related to the procurement of input equipment.
The report is generated based on the most recent financial or calendar year, concluding in months such as June or December.
Dashboards designed for decision makers in a report-ready format suitable for efficient communication to others.
Available across the Top 20 fruit and vegetable categories.


